1/6 📊
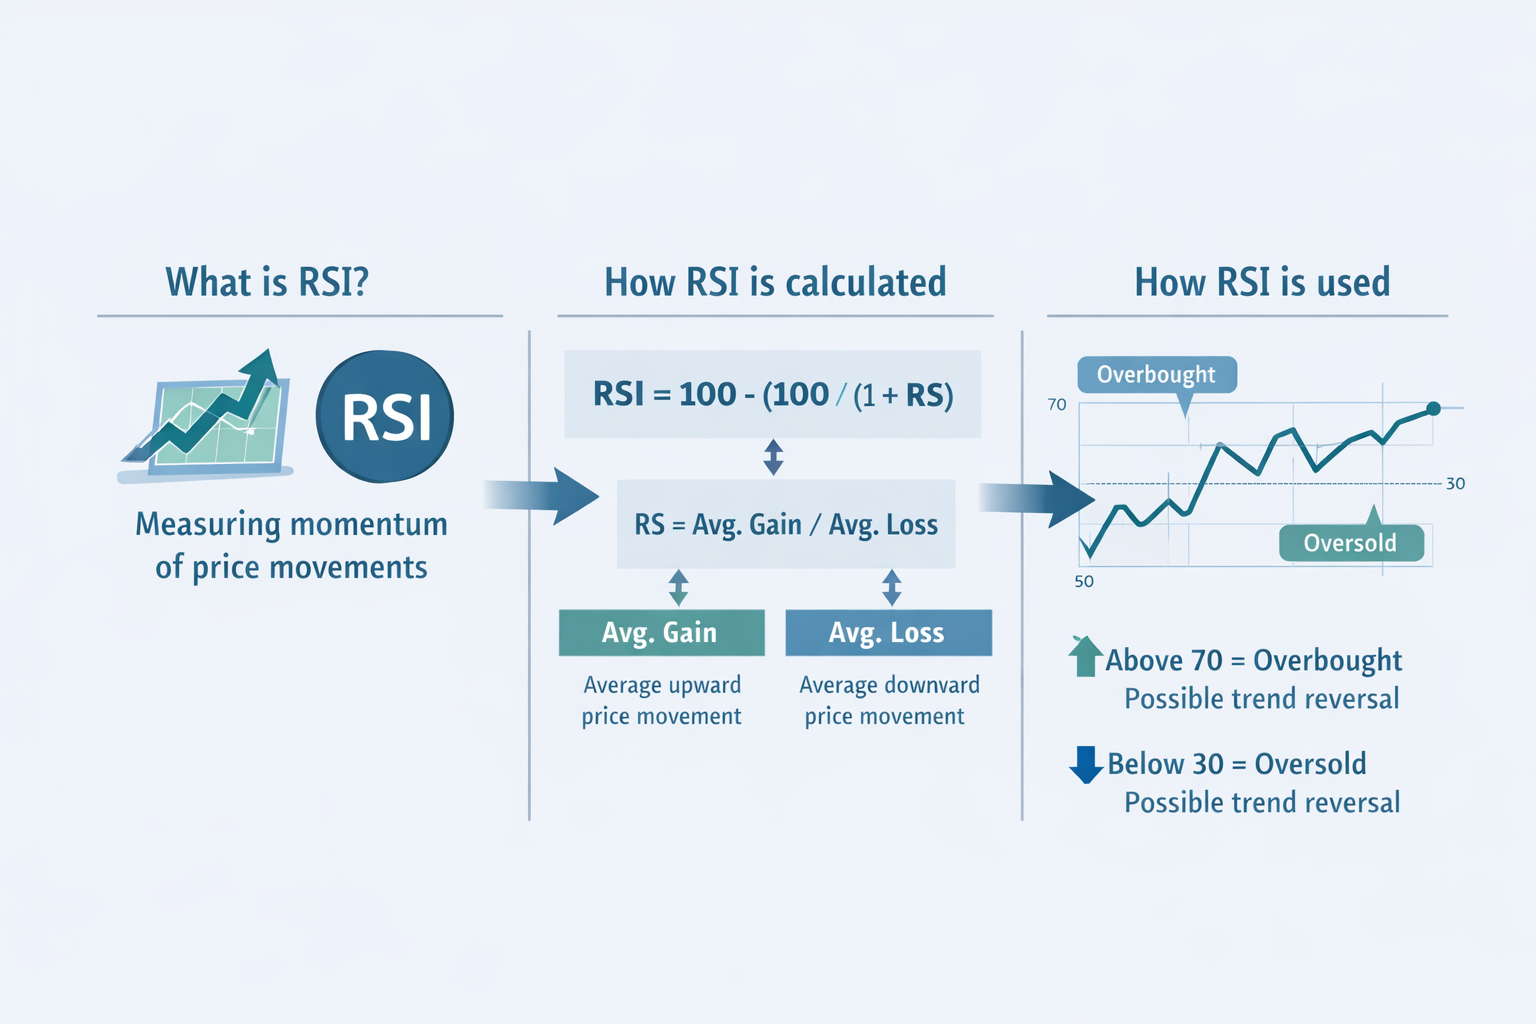
The Relative Strength Index (RSI) is a popular technical indicator that measures price momentum to identify overbought and oversold market conditions #RSI #TechnicalAnalysis #TradingBasics #ningenie #ninx #ninjapay
2/6 ⚖️
RSI values range from 0 to 100, with readings above 70 signaling overbought conditions and readings below 30 indicating oversold levels #MomentumTrading #MarketSignals #ChartIndicators #ningenie #ninx #ninjapay
3/6 🔍
By comparing average gains and losses over a standard 14-period timeframe, RSI helps traders gauge the strength of ongoing trends #PriceAction #TrendAnalysis #TradingTools #ningenie #ninx #ninjapay
4/6 🟢
A common buy signal occurs when RSI rises above 30 after being oversold, suggesting weakening selling pressure and a potential upward move #BuySignal #TradingStrategy #RSITrading #ningenie #ninx #ninjapay
5/6 🔴
A typical sell signal appears when RSI falls below 70 from higher levels, hinting that bullish momentum may be fading #SellSignal #RiskManagement #MarketTiming #ningenie #ninx #ninjapay
6/6 🧠
RSI works best when combined with other indicators and market context, as strong trends can keep RSI overbought or oversold for extended periods #SmartTrading #MarketContext #FintechEducation #ningenie #ninx #ninjapay